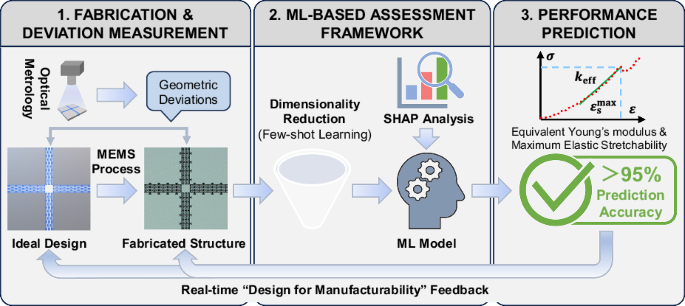
The workflow of the ML-based assessment of fabrication deviation induced mechanical performance variations in stretchable silicon array is schematically presented in Fig. 1. The workflow includes three stages: data preparation, ML modeling, and model-assisted fabrication development. This work starts with the preparation of the Parylene 3D KiSS array. During the data preparation stage, optical microscope (OM)-based CD measurement is performed on the as-fabricated Parylene 3D Kirigami-like stretchable microstructures for rapid measurement of the feature sizes, including adjacent Parylene beam spacing w, slit length l, minimum line width λ, and adjacent slit spacing s. Uniaxial tensile tests are conducted on the as-fabricated Parylene 3D KiSS array to obtain stress-strain curves. Two mechanical performance of behaviors, the equivalent Young’s modulus \({k}_{{\rm{e}}{\rm{ff}}}\) and the maximum elastic stretchability \({\varepsilon }_{{\rm{s}}}^{\max }\), are extracted from the stress-strain curve. During the ML modeling stage, two distinct frameworks are systematically implemented: a multilayer-perceptron (MLP) framework and a tree-based CatBoost framework. A performance-driven selection protocol is subsequently executed to identify the optimally configured model with the highest prediction accuracy. During model-assisted fabrication development stage, we demonstrate two key functions of our ML-based assessment methodology in facilitating batch manufacturing of Parylene 3D KiSS arrays: (1) critical feature size extraction and (2) wafer-level assessment of qualification probability during fabrication. The subsequent sections will provide comprehensive delineations of each stage within the assessment methodology.

Workflow of the ML-based assessment methodology in predicting mechanical performance variations induced by fabrication deviation
Data preparation
The Parylene 3D KiSS arrays are prepared through a wafer-level microfabrication process with MEMS and post-CMOS fabrication techniques. Figure 2a, b shows the stretchable silicon arrays in a 4-inch wafer in-process. The feature sizes of the Parylene 3D Kirigami-like microstructures are defined by photolithography and subsequent deep reactive ion etching (DRIE). The feature sizes adopted for mechanical performance assessment are measured post-etching by optical microscope. Figure 2c shows the stretchable silicon array under tensile testing. The equivalent Young’s modulus \({k}_{{\rm{e}}{\rm{ff}}}\) and the maximum elastic stretchability \({\varepsilon }_{{\rm{s}}}^{\max }\) are calculated from the stress-strain curves obtained via tensile tests. To build the ML dataset, we randomly select specimens from three wafers produced in the same batch, yielding 22 valid samples that are subsequently divided into training and testing sets.

a The image of Parylene 3D KiSS arrays in 4-inch wafer. b Optical micrograph of a representative array that incorporates Parylene 3D micro-kirigami interconnects. c The Parylene 3D KiSS array during tensile testing. The equivalent Young’s modulus \({k}_{{\rm{e}}{\rm{ff}}}\) deviation and maximum elastic stretchability \({\varepsilon }_{{\rm{s}}}^{\max }\) deviation for 22 specimens due to deviation of different feature sizes are shown in (d) and (e), respectively
Figure 2d, e showed the deviations of the equivalent Young’s modulus and the maximum elastic stretchability, respectively, of these stretchable silicon arrays. The results were compared to the average values. The data reveal substantial dispersion: the equivalent Young’s modulus exhibited a maximum deviation of 36.3% from its mean and the maximum elastic stretchability displayed a maximum deviation of 19.4% from its mean. Notably, the maximum deviation in any geometric feature sizes in the corresponding Parylene 3D Kirigami-like microstructures reaches only 9.36%, indicating a pronounced amplification effect of feature size deviations on mechanical performance variations. This three- to four-fold mismatch underscores a strong amplification effect, whereby small fabrication-induced geometric deviations translate into large shifts in mechanical performances. Therefore, establishing an accurate prediction model correlating feature sizes to mechanical performances is essential for the assessment of fabrication deviations in Parylene 3D KiSS array.
ML modeling
Establishing ML models that generalize well on limited samples is challenging, especially considering the nonlinear relationships between feature size and mechanical performances \({k}_{{\rm{e}}{\rm{ff}}}\& {\varepsilon }_{{\rm{s}}}^{\max }\). Consequently, we employ two frameworks: a MLP and a tree-based CatBoost model, both have been proven effective for small-sample regression analyses28,29,30. The architecture of the proposed model is illustrated in Fig. 3a.

a Schematic of the proposed ML architecture. b The training MSE and testing accuracy traces for the four optimal \({\varepsilon }_{{\rm{s}}}^{\max }\) ML models. c Performance comparison for the four optimal \({\varepsilon }_{{\rm{s}}}^{\max }\) ML models. d The training MSE and testing accuracy traces for the four optimal \({k}_{{\rm{e}}{\rm{ff}}}\) ML models. e Performance comparison for the four optimal \({k}_{{\rm{e}}{\rm{ff}}}\) ML models
Let \({{\boldsymbol{x}}}_{{\boldsymbol{k}}}\epsilon {{\mathbb{R}}}^{{\boldsymbol{k}}}\) denotes the geometric parameter vector characterizing the Parylene 3D Kirigami-like microstructures, where \({{\boldsymbol{x}}}_{{\boldsymbol{k}}}={[{x}_{1},{x}_{2},…,{x}_{k}]}^{T}\) with each element \({x}_{i}\)(\(i=\mathrm{1,2},\ldots ,k\)) representing a specific feature size. This parameter vector serves as the input parameters of the ML models. The equivalent Young’s modulus \({k}_{{\rm{eff}}}\) and the maximum elastic stretchability \({\varepsilon }_{{\rm{s}}}^{\max }\) are defined as the output parameters of the ML models. The Parylene 3D KiSS microstructure exhibits mechanical behavior that is primarily governed by relative geometrical proportions rather than absolute dimensions. In particular, both the slit length l and the minimum line width λ scale naturally with the adjacent slit spacing s, meaning that the ratios \(l/s\) and \(\lambda /s\) capture the key deformation-relevant geometry. The in-plane stretching behavior of this microstructure originates from beam bending, which implies that the ratio of \(l/s\) is capable of describing the size-dependent characteristics of the microstructure. The ratio \(\lambda /s\) is utilized for dimensionality reduction as it is defined by the proportion of the real feature size of the beam to the slits spacing s. In contrast, the adjacent Parylene beam spacing w does not form a meaningful proportional relationship with s, and therefore retaining win its absolute form preserves essential geometric information. Based on these considerations, dimensionality reduction is implemented, transforming the original four-dimensional feature space (\({{\boldsymbol{x}}}_{{\boldsymbol{4}}}={[l,s,w,\lambda ]}^{T}\)) into a three-dimensional feature space (\({{\boldsymbol{x}}}_{{\boldsymbol{3}}}={[l/s,w,\lambda /s]}^{T}\)). We think such a dimensionality reduction can not only decreases effective degrees of freedom but also suppress spurious correlations among geometric parameters to mitigate overfitting in the few-shot ML modeling setting. On this basis, considering the substantial scale difference between \({k}_{{\rm{eff}}}\) and \({\varepsilon }_{{\rm{s}}}^{\max }\), we construct four MLP models and four CatBoost models to represent the unknown relationship between mechanical performances \({k}_{{\rm{eff}}}\& {\varepsilon }_{{\rm{s}}}^{\max }\) and the statistical variables \({{\boldsymbol{x}}}_{{\boldsymbol{3}}}\& {{\boldsymbol{x}}}_{{\boldsymbol{4}}}\). The input-output configurations of the eight ML models are schematically summarized in Table 1. The M4e model represents a four-dimensional input MLP framework with the maximum elastic stretchability \({\varepsilon }_{{\rm{s}}}^{\max }\) as its output. Analogously, the C3k model constitutes a three-dimensional input Catboost configuration designed to predict the equivalent Young’s modulus \({k}_{{\rm{e}}{\rm{ff}}}\). The accuracy of the ML models is quantified by evaluating mean squared errors (MSE) and mean accuracy. The calculation formulas are as follows:
$${MSE}=\frac{1}{n}\mathop{\sum }\limits_{i=1}^{n}{({\hat{y}}_{i}-{y}_{i})}^{2}$$
(1)
$${mean\; accuracy}=1-{MAPE}=1-\frac{1}{n}\mathop{\sum }\limits_{i=1}^{n}\left|\frac{{\hat{y}}_{i}-{y}_{i}}{{y}_{i}}\right|$$
(2)
where n is the total number of samples in the dataset, \({\hat{y}}_{i}\) is the predicted value of the i-th sample, \({y}_{i}\) is the observed value of the i-th sample.
All the eight models are optimized using a systematic grid-search procedure to identify the best-performing hyperparameters. For tree-based CatBoost models, the tuned hyperparameters include the number of estimators, maximum tree depth, learning rate, and L2 regularization coefficient for leaf values. For neural-network MLP models, the search space covers the number of hidden layers, neurons per layer, learning rate, and early stopping criterion. For each model, a predefined search space is constructed based on commonly used hyperparameters. Each hyperparameter combination is evaluated by computing the mean accuracy on the testing folds, and the configuration yielding the highest accuracy is selected as the optimal setting. Figure 3b shows the training MSE and testing accuracy curves for the four \({\varepsilon }_{{\rm{s}}}^{\max }\) prediction models (M4e, M3e, C4e and C3e) under optimal hyperparameter configurations. All training loss curves exhibit gradual reduction and convergence, while testing accuracy curves demonstrate progressive improvement and stabilization, confirming stable training dynamics. After sufficient iterations, all models achieve accuracies exceeding 90%, validating the feasibility of ML for manufacturing parameter prediction. As shown in Fig. 3c, M4e, M3e, C4e, and C3e achieve prediction accuracy values of 95.51%, 94.44%, 95.25%, and 94.78%, respectively. When comparing the MLP model with the CatBoost model, negligible differences are observed in training MSE and testing accuracy, indicating that both frameworks exhibit comparable effectiveness in the \({\varepsilon }_{{\rm{s}}}^{\max }\) prediction. The four-dimensional models M4e & C4e demonstrate a slight edge over the three-dimensional models M3e & C3e in both training MSE and testing accuracy, suggesting that dimensionality reduction in \({\varepsilon }_{{\rm{s}}}^{\max }\) ML models might lead to the potential loss of features. Among all four \({\varepsilon }_{{\rm{s}}}^{\max }\) prediction models, the four-dimensional MLP model M4e exhibits the best performance with the lowest training MSE (1.064) and the highest testing accuracy (95.51%).
Similarly, Fig. 3d shows the training MSE and testing accuracy curves for the four \({k}_{{\rm{eff}}}\) prediction models (M4k, M3k, C4k and C3k) under optimal hyperparameter configurations. As shown in Fig. 3e, M4k, M3k, C4k, and C3k achieved prediction accuracy values of 95.94%, 97.27%, 93.48%, and 91.73%, respectively. When comparing the MLP model with the CatBoost model, the MLP framework demonstrates statistically significant advantages in both training MSE and testing accuracy, suggesting the limitations of the CatBoost framework for \({k}_{{\rm{eff}}}\) prediction. Furthermore, the three-dimensional MLP model M3k exhibits marked superiority over its four-dimensional counterpart M4k across training MSE and testing accuracy, demonstrating the effectiveness of dimensionality reduction within the MLP framework. Among all four \({k}_{{\rm{eff}}}\) prediction models, the three-dimensional MLP model M3k exhibits the best performance owing to the lowest training MSE (4.7 × 10⁻⁴) and the highest testing accuracy (97.27%).
Therefore, through the systematic implementation of dimensionality reduction and comparative evaluation of two distinct ML frameworks, the optimally configurated ML model has been conclusively identified. Models M4e and M3k, exhibiting superior prediction performances, are selected as reliable mapping frameworks for subsequent analysis.
Model-assisted manufacturing development
To quantify how the four geometric features affect the equivalent Young’s modulus \({k}_{{\rm{eff}}}\) and the maximum elastic stretchability \({\varepsilon }_{{\rm{s}}}^{\max }\), SHAP algorithm is applied to extract feature importance from the reliable models M4e and M3k. SHAP algorithm assigns a corresponding SHAP value to each inputting parameter, facilitating a quantitative appraisal of its contribution to the model output31. By visualizing the mean absolute SHAP values, the relative importance of each inputting parameter within the model can be ranked. Higher SHAP values indicate stronger impacts on model’s prediction values. As illustrated in Fig. 4a, b, results of mean absolute SHAP values reveal that parameter λ dominates \({\varepsilon }_{{\rm{s}}}^{\max }\), while s exerts the greatest influence on \({k}_{{\rm{eff}}}\). These findings align with results derived from structural mechanics analytical models16, validating the accuracy of our ML-based mapping framework. The model-based SHAP analysis fully confirms the powerful capability of our methodology in identifying critical process parameters in stretchable silicon array fabrication. Overall, the SHAP analysis demonstrates that the proposed framework reliably pinpoints the process parameters that dictate mechanical performances in Parylene 3D KiSS array fabrication.

a Normalized mean SHAP value ranking of the geometric variables in the reliable \({\varepsilon }_{{\rm{s}}}^{\max }\) model M4e. b Normalized mean SHAP value ranking of the same geometric variables in the reliable \({k}_{{\rm{eff}}}\) model M3k. c One hundred Gaussian data sets that emulate fabrication-induced variation in the chosen primary feature. d Uniform distributed statistical datasets of the remaining three feature sizes. e Batch-prediction map used to classify samples as qualified or unqualified and to compute the corresponding yield. f Linear-regression fits to σ–yield curves for all four geometric parameters
Furthermore, leveraging the Monte Carlo (MC) method for uncertainty quantification32,33,34,35, we demonstrate our ML model’s utility for quantitative process window analysis in stretchable silicon array fabrication by inputting statistical data with progressively larger standard deviations (σ) into the reliable models M4e and M3k. The detailed workflow is schematically illustrated from Fig. 4c–f. For each feature size, the standard deviations (σ) of all 22 samples are calculated to get the baseline variability. Firstly, one of the feature sizes is selected as the primary parameter. To simulate fabrication-induced geometrical deviations, 100 Gaussian-distributed statistical data sets (σ ranging from 0 to the half of the sample standard deviations) are generated for the primary parameter. Each dataset contains 1000 samples and 100 statistical realizations, forming a three-dimensional array of size 1000 × 1 × 100, as shown in Fig. 4c. An increased σ corresponds to greater dispersion in the feature size’s statistical distribution, which means that the inconsistency in manufacturing becomes stronger.
The remaining three feature sizes are simultaneously sampled from uniform distributions bounded by their measured ranges, forming a 1000 × 3 × 100 array, as shown in Fig. 4d. The combined data sets are passed through our reliable ML model, producing batch predictions of \({\varepsilon }_{{\rm{s}}}^{\max }\) and \({k}_{{\rm{eff}}}\). Samples satisfying both \({k}_{{\rm{eff}}}\) ∈ [0.4, 0.5] and \({\varepsilon }_{{\rm{s}}}^{\max }\) ∈ [28, 31] are classified as qualified; others are deemed unqualified. The yield (Y) is therefore defined as:
$$Y=\frac{{N}_{{\rm{qualified}}}}{{N}_{{\rm{total}}}}$$
(3)
where \({N}_{{\rm{qualified}}}\) and \({N}_{{\rm{total}}}\) represent the numbers of qualified and total samples of Parylene 3D KiSS arrays, respectively.
The batch prediction outcomes are categorized according to the above criteria, as shown in Fig. 4e. By varying σ of the primary parameter, the relationship between σ and predicted yield (Y) is analyzed quantitatively. Scatter plots are constructed with σ on the x-axis and Y on the y-axis to visualize how increasing geometrical uncertainty influences the expected manufacturing yield. Repeating this process by designating each of the four geometrical parameters as the primary parameter in turn allows evaluation of the σ–Y relationships for all parameters, with linear fits shown in Fig. 4f.
The results reveal that the expected yield exhibits a decline with increasing σ of feature sizes λ and l, aligning with conventional observations of negative correlation between fabrication deviations and yields. However, anomalous positive correlations emerged for feature sizes w and s. We hypothesize that this anomaly is attributed to (1) the midpoint mismatch between the distribution interval and (2) the dual-constraint interplay induced by the simultaneous consideration of \({\varepsilon }_{{\rm{s}}}^{\max }\) and \({k}_{{\rm{eff}}}\). Nevertheless, this methodology enables real-time process-window extraction and quantitatively highlights gaps between current process capability and target yield requirements—thereby guiding tolerance allocation in Parylene 3D KiSS array manufacturing.
Model-assisted in-line assessment of mechanical performances
Based on the aforementioned models for real-time prediction of the equivalent Young’s modulus \({k}_{{\rm{eff}}}\) and the maximum elastic stretchability \({\varepsilon }_{{\rm{s}}}^{\max }\), we demonstrate how the framework estimates qualification probability during Parylene 3D KiSS fabrication. As depicted in Fig. 5, in-line metrology acquires three geometric parameters—l, w, and s—while λ remains unmeasured, reflecting scenarios in which not every feature can be captured within a single process step. By treating λ as a random variable and propagating its anticipated distribution, together with the measured values of l, w, and s, through the trained models, we compute the probability that each in-process array will satisfy the dual specifications on \({k}_{{\rm{eff}}}\) and \({\varepsilon }_{{\rm{s}}}^{\max }\). This capability enables real-time, sample-specific risk screening and adaptive process control in the production line.

Red points indicate samples failing both the \({k}_{\text{eff}}\) and \({\varepsilon }_{s}^{\max }\) criteria; purple points represent samples meeting the \({k}_{\text{eff}}\) requirement but failing the \({\varepsilon }_{s}^{\max }\) requirement; blue points represent samples satisfying \({\varepsilon }_{s}^{\max }\) but not \({k}_{\text{eff}}\); and green points denote samples that satisfy both criteria
Following the same strategy used for process-window analysis, we perform a 1000-iteration Monte Carlo (MC) simulation for each in-line sample. Consequently, for a given Parylene 3D KiSS array i, the measured geometric feature sizes (l, w, and s) are replicated into 3 × 1000 matrices, while the unknown λ parameter is stochastically sampled 1000 times within its allowable tolerance window. The resulting hybrid data set is fed into the reliable ML models to predict \({k}_{{\rm{eff}}}\) and \({\varepsilon }_{{\rm{s}}}^{\max }\).
Adopting the same mechanical performance specification limits defined earlier, we compute the qualification probability Pqual for each sample immediately after photolithography, which is well before λ is fixed in later steps. A sample with high Pqual indicates robust l, w, and s combinations with low λ-related process risks, whereas a sample with low Pqual is defined as a high-risk sample. For instance, sample i in Fig. 5 yields Pqual = 15.3%, far below the target threshold, signaling the need for extra adjustments of the fabrication deviations of λ in subsequent process.
Repeating this quasi–Monte Carlo (QMC) procedure across all sites on the wafer, wafer-level assessment of qualification probability for Parylene 3D KiSS array can be achieved. The proposed real-time assessment methodology of fabrication deviation induced mechanical performance variations enables in-line wafer qualification probability decision-making, empowering high-consistency manufacturing of Parylene 3D KiSS arrays.

