Study design
This was a prospective observational study involving patients with neurological diseases and their treating physicians at the Juntendo University Hospital (Tokyo, Japan). The study design was based on previous studies that evaluated perceptions of patient health status between patients and physicians10,13,14,23. Patients and their physicians answered questionnaires on PROs and OROs at two regular outpatient check-up visits. Patients completed the questionnaires during each visit, whereas physicians completed the questionnaires immediately after each visit and answered only once for common items between questionnaires that were not patient-dependent. Differences between questionnaire responses for each patient and their treating physician were analyzed as ‘gaps’. Although the validity of physicians providing responses to a PRO and patients providing responses to an ORO has not been evaluated, this approach has been undertaken in other studies focusing on perception gaps between patients and physicians8,9,14, and was considered necessary and appropriate for achieving the objectives of this study.
The study protocol and all amendments were approved by the Juntendo University Hospital ethics committee (approval number E22-0162). The study was conducted according to the ethical principles of the Declaration of Helsinki. Informed consent was obtained from each patient at visit 1 before participating in the study. This study is registered on the Japan Registry of Clinical Trials: jRCT1030220258 (https://jrct.mhlw.go.jp/en-latest-detail/jRCT1030220258).
Study population
Patients with Parkinson’s disease, multiple sclerosis, or epilepsy visiting the Department of Neurology at Juntendo University Hospital for at least 3 months and who visited at least once in the past 3 months were eligible for inclusion. Patients were excluded if they were under 18 years of age at the time of consent, unable to answer questionnaires (e.g., owing to cognitive dysfunction), or deemed unsuitable for inclusion by the study investigator.
Procedures
Patients and their treating physicians were given validated questionnaires to capture their perceptions of patient satisfaction (PSQ-18, SDM-Q-9/SDM-Q-Doc)24, ADLs (Barthel Index) and patient QoL (36-item Short Form [SF-36]; Supplementary Table 6). Additionally, disease-specific scales were used for items that could not be generalized across different neurological conditions. These included the Parkinson’s Disease Questionnaire-39 (PDQ-39)25, Movement Disorder Society Unified Parkinson’s Disease Rating Scale (MDS-UPDRS)26, Hoehn and Yahr scale27, Multiple Sclerosis Quality of Life-54 (MSQOL-54)28, EDSS29, and Patient-weighted Quality of Life in Epilepsy (QOLIE-31-P)30. Physician information (e.g., age, sex, specialist qualification, years of experience, number of patients treated) was collected separately. An original questionnaire was also distributed to assess items for which no validated assessment scale exists.
Responses to questionnaires were obtained at two outpatient visits (visit 1 and visit 2), which followed each patient’s regular appointments. Patients provided informed consent and were enrolled in the study at visit 1. Visit 2 was defined as the next scheduled appointment visit. No evaluations were performed between visits. Patients and physicians each inputted their responses onto an electronic device. Data were managed on a cloud-based system and collected through an Electronic Data Capture (EDC) platform (hashPeak, Tokyo, Japan), which employs blockchain technology to ensure data integrity and security. Data entries were timestamped, encrypted, and stored in a decentralized ledger, allowing for secure tracking and auditing throughout the study.
Outcomes
The primary outcome was the difference between scores of pairwise items in the questionnaires (PSQ-18, SDM-Q-9/SDM-Q-Doc, Barthel Index, and the original questionnaire) answered by both patients and physicians (i.e. perception gap). Patients and physicians were also asked to rank the SF-36 subdomain that they prioritized as the most important in terms of their or their patient’s QoL, respectively.
The PSQ-18 is a tool used to assess patient satisfaction with healthcare services. It measures general satisfaction, interpersonal manner, communication effectiveness, financial consideration, duration of interaction, and ease of access31. The SDM-Q-9 and SDM-Q-Doc are questionnaires that measure the extent to which patients are involved in the process of decision-making and the extent to which physicians involve patients in the decision-making process, respectively32. The Barthel Index is an ordinal scale that measures a person’s ability to complete ADLs, including feeding, bathing, grooming, dressing, bowel control, bladder control, toileting, chair transfer, ambulation, and stair climbing33. The SF-36 is a commonly used questionnaire that measures overall health and well-being. It assesses eight different subdomains: physical functioning, role physical, bodily pain, general health, vitality, social functioning, role emotional, and mental health34. The original questionnaire developed for the current study was used to assess items for which no validated assessment scales exist. This included items about patient characteristics, disease, or treatment questions, the relationship with the physician, the physician’s clinical policy, and feelings about the medical practice.
Secondary outcomes included factors influencing perception gaps in patient satisfaction, SDM, assessment of ADLs, pairwise items assessed in the original questionnaire, and QoL that were identified in the primary outcome.
Data on potential factors influencing perception gaps were collected using disease-specific tools, including the PDQ-39 and MDS-UPDRS for Parkinson’s disease; MSQOL-54 for multiple sclerosis; QOLIE-31-P for epilepsy; the full SF-36 survey34, original questionnaire, and medical record data for all patients (regardless of disease); and physician information.
An exploratory outcome was the development and evaluation of a predictive model for patient–physician gap recognition using AI machine learning.
Statistical analysis
A total sample size of 200 patients (Parkinson’s disease, 140; multiple sclerosis, 40; and epilepsy, 20), based on the historical number of outpatients at the Juntendo University Hospital, as well as 13 physicians were planned for recruitment. All enrolled participants, excluding those who withdrew consent and refused use of their data or had no data recorded after enrollment, were included for study analyses. Questionnaire items that were not answered or could not be obtained were treated as missing values. Missing values were neither assigned nor imputed. Patient and physician responses were analyzed as individual and total scores. For the primary outcome, the ‘sum of the relative difference in patient and physician responses (Yr)’ to each questionnaire was calculated using the following formula.
$$Yr=\left(Xp1-Xi1\right)+(Xp2-Xi2)+\dots +\left(Xpk-Xik\right)+\dots +(Xpn-Xin)$$
k: Question k, n: Number of questions in the questionnaire, Xpk: The kth question score of the questionnaire answered by the patient (according to the scoring of the questionnaire), Xik: Score of question k of the questionnaire answered by the physician (according to the scoring of the questionnaire).
Because subtracting a patient response from a physician response can result in a negative or positive value, there is potential for scores of individual questions to offset each other when summing across the entire questionnaire for obtaining the ‘relative difference’. For this reason, we also calculated the ‘sum of the absolute difference between patient and physician responses (Ya)’ to each questionnaire using the following formula, where paratheses of the Yr formula are replaced with absolute value signs to obtain a positive value:
$$Ya=\left|Xp1-Xi1\right|+\left|Xp2-Xi2\right|+\dots +\left|Xpk-Xik\right|+\dots +|Xpn-Xin|$$
In addition to the primary analysis, the total score of patients (Yp) and the total score of physicians (Yi) were calculated. Both total scores were defined as the sum of the scores of individual questions of each questionnaire. Differences between the total scores of patients and physicians were compared using the Mann–Whitney U test. The degree of correlation between patient and physician responses for each questionnaire was calculated using the kappa coefficient.
The distribution of the perception gap was classified into ‘concordant’ and ‘discordant’ groups, based on the median value of the Ya. Differences smaller than or equal to the median were included in the concordant group and differences larger than the median were included in the discordant group. A cross-tabulation analysis of patient and physician background factors was performed between the concordant and discordant groups to determine their potential influence on the perception gap using Fisher’s exact test.
Correlations of differences between questionnaires (except for SF-36 subdomains) in terms of the Ya were evaluated using Spearman’s correlation coefficients. For the correlation of the SF-36 subdomain with other questionnaires, summary statistics for concordance/discordance of the SF-36 subdomain with each questionnaire in terms of the Ya were calculated and compared using the Mann–Whitney U test.
A univariate analysis was conducted to assess the association between patient characteristics and physician attributes that could potentially influence the perception gap using the Spearman’s correlation coefficient. A subsequent multiple regression analysis was performed using disease type as the dependent variable and significant patient characteristics/physician attributes (P < 0.05; as determined from the univariate analysis) as independent variables.
SPSS Statistics 26 (IBM Corporation, Armonk, NY, USA) was used for statistical analyses.
Model development
The patient and physician data set was used to develop and evaluate predictive models for recognizing perception gaps between patients and physicians. A supervised machine learning model was developed and trained on primary outcome data and secondary outcome response data. The perception gap was treated as a binary variable (concordant and discordant groups). To ensure robust cross-testing and efficacy in predicting perception gaps, we employed multiple machine learning algorithms, which included k-nearest neighbors, random forest, ensemble methods, neural networks, logistic regression, boosting, linear support vector machines, decision trees, and naïve bayes.
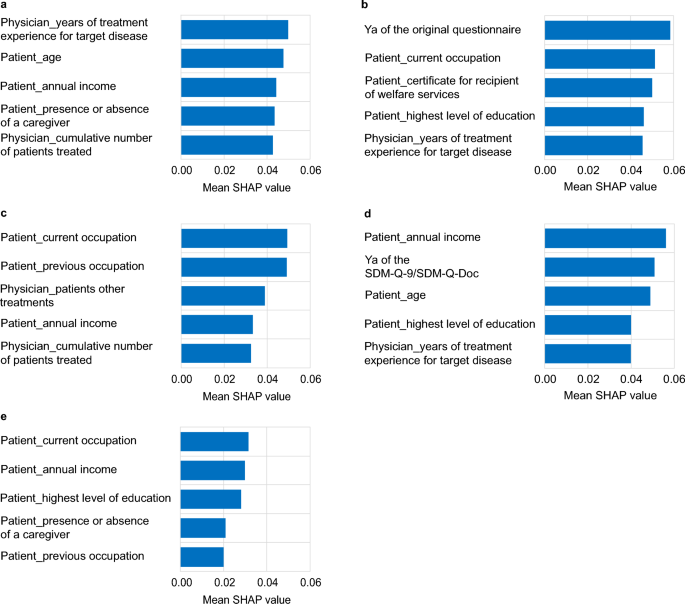
The target of the analysis was the difference between the patient and physician scores for the PSQ-18, SDM-9-Q/SDM-Q-Doc, Barthel Index, the original questionnaire (pairwise items evaluated by patients and physicians), and the responses to the SF-36 subdomain. The features of the learning model were patient and physician total scores of PSQ-18, SDM-9-Q/SDM-Q-Doc, Barthel Index, the original questionnaire, and the SF-36 subdomain; physician attribute information; patient-specific questionnaires (excluding patient–physician pairwise assessments and disease-specific assessments); and relevant medical record data. To enhance model inference accuracy, we performed feature selection using SHAP values to identify and retain the top 15 most influential features. This helped to reduce dimensionality while preserving the most predictive variables. To improve model training stability and generalization, the dataset was duplicated to increase the number of epochs. This approach aimed to mitigate overfitting and enhance model robustness in a high-dimensional context with small sample sizes.
Model validation
To evaluate model accuracy, fivefold cross-validation was used, with each fold serving once as a validation set while being trained on the remaining folds. Additionally, 20% of the data were withheld as a separate test set to further assess model generalization. Model performance was measured using log loss, which evaluates the degree to which predicted probabilities diverge from actual class labels, and AUC-ROC, indicative of the model’s ability to distinguish between classes35. To ensure the best balance between true and false positives and negatives, the Matthew’s correlation coefficient (MCC) was considered for selecting the classification threshold using the following formula36.
$$MCC=\left(\left(TP\times TN-FP\times FN\right)\right)\div \surd (\left(TP+FP\right)\left(TP+FN\right)\left(TN+FN\right))$$
TP: True Positive, TN: True Negative, FP: False Positive, FN: False Negative.
Initial hyperparameter values were adopted from default settings provided by the respective machine learning libraries. Subsequent tuning was conducted on the model with the lowest log loss to refine performance, utilizing a grid search approach over a defined parameter space. This process was iteratively performed with varying parameters to identify the model configuration with the highest predictive accuracy. The final model development and analysis were conducted using Python 3.8.17 (Python Software Foundation).