research design
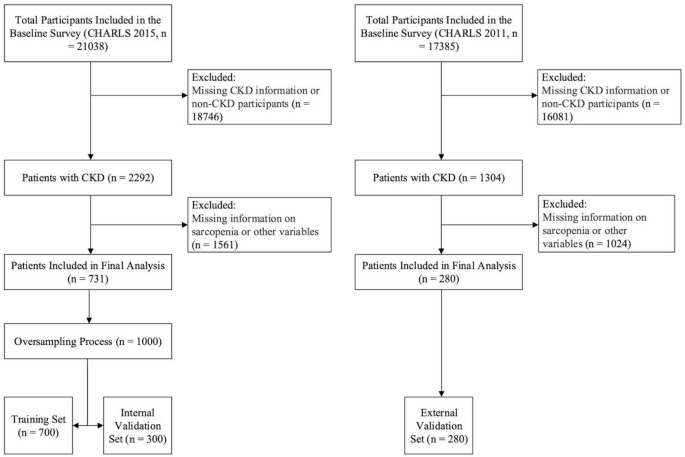
This study utilized a cross-sectional research design based on CHARLS 2015 and 2011 data published at http://charls.pku.edu.cn. CHARLS is a national longitudinal cohort study that aims to collect health and retirement-related information on China’s middle-aged and older population aged 45 years and older. CHARLS drew a representative sample from 28 provinces, municipalities, and autonomous regions across China through a multistage stratified probability proportional sampling method. In this study, we screened eligible CKD patients and built and validated a sarcopenia risk prediction model in CKD patients based on CHARLS data. The original CHARLS was approved by the Peking University Ethics Review Board (IRB00001052-11015), and all participants signed an informed consent form before participation.twenty one.
Research subject
If the subject answered “yes” to the question “Have you ever been told that you have kidney disease?” or eGFR less than 60 mL/min/1.73 m2was diagnosed with CKD.
Assessment of sarcopenia
According to the Asian Working Group on Sarcopenia (AWGS) 2019 Consensus, the three core components for assessing sarcopenia are muscle strength, limb skeletal muscle (ASM), and physical performance.22, 23, 24.
-
1.
Low muscle strength: Grip strength of 28 kg or less for men and 18 kg or less for women.
-
2.
Skeletal muscle mass (ASM) and skeletal muscle mass index (SMI) are calculated using the following formulas:
ASM = 0.193 × weight (kg) + 0.107 × height (cm) − 4.157 × gender − 0.037 × age (years) − 2.631 (coded as 1 for males and 2 for females).
SMI = ASM / height².
The low muscle mass threshold is a sex-specific value for the bottom 20% of SMI in the population. 7.28 kg/m2 for men and 5.55 kg/m2 for women.
3. Low physical performance: step velocity < 1.0 m/s or 5 chair stand tests ≥ 12 seconds.
People who have low muscle mass, low strength, and low physical performance are classified as having sarcopenia.
Sociodemographic factors
The study collected participants’ sociodemographic characteristics such as age, gender, marital status, and educational background. Age was recorded according to actual age and gender, such as male or female. Marital status includes married and single. Educational background is categorized into “junior high school or below”, “junior high school”, “high school”, and “university or above”. The above sociodemographic factors may be associated with the risk of developing sarcopenia in patients with chronic kidney disease and should be controlled and investigated in statistical analysis.
Behavioral and psychological factors
Behavioral factors include activities of daily living (ADLs), instrumental activities of daily living (IADLs), drinking status, smoking status, and sleep duration. Psychological factors include participants’ mental health and cognitive functioning. ADL and IADL assess participants’ ability to care for themselves and perform complex tasks in daily life. The CHARLS questionnaire consists of 6 ADL items (dressing, bathing, eating, transferring, toileting, and incontinence) and 5 IADL items (housework, cooking, shopping, money management, and medication). Each item was scored as 1 if the subject had difficulty performing it. For each item, a score of 0 indicates complete independence, and a score greater than 0 is considered dependent, indicating that you need help or support in some area.25, 26, 27. Drinking and smoking history was scored as “yes” or “no.” Sleep duration data were obtained from the question, “During the past month, how many hours did you sleep at night (average number of hours per night)?” Mental health was assessed using the CESD-10 (Center for Epidemiological Studies Depression Scale 10), a short 10-question scale that measures an individual’s emotional, behavioral, and physical symptoms over the past week to help screen for depression. Each question is scored based on frequency, with higher scores indicating more severe depressive symptoms. A score of 10 or higher indicates a high risk of depression.twenty three. Cognitive function is an essential aspect of assessing an individual’s thinking and memory abilities and typically includes visuospatial abilities, memory, orientation, and attention. In a test of visuospatial ability, participants are asked to redraw a picture of an overlapping pentagram. Those who drew correctly received 1 point, and those who drew incorrectly received 0 points. Memory was assessed by averaging the immediate and delayed recall scores for 10 Chinese words, with 1 point awarded for each correctly recalled word. Orientation and attention were measured by the Telephone Interview on Cognitive Status (TICS-10). This test consists of questions about basic orientation information such as date, time, day of the week, season, and requires subtracting 7 consecutively from 100 (up to 5 times). Each correct answer gives you 1 point, and the final score ranges from 0 to 10. Cognitive function assessment results range from 0 to 21, with higher scores indicating better cognitive function. Functioning; low scores may indicate dysfunction or decline28.
health factors
Health factors include participants’ past medical history, physical measurements, and laboratory test results. Past medical history includes history of hypertension, diabetes, cancer, heart disease, stroke, arthritis, dyslipidemia, asthma, memory-related disorders, and kidney disease. Physical measurements included systolic blood pressure, diastolic blood pressure, grip strength, height, weight, waist circumference, gait speed, and functional status (disability status, pain level). BMI (weight/height)2) was calculated to assess nutritional status. Laboratory tests include blood white blood cell count, platelet count, fasting glucose, triglycerides, HDL cholesterol, LDL cholesterol, C-reactive protein, glycosylated hemoglobin, hemoglobin, blood urea nitrogen, blood uric acid, cystatin C, and creatinine. Additionally, glomerular filtration rate (eGFR) was calculated and included in the analysis using the CKD-EPI formula (Table S1).29,30and the above health indicators may reflect the physiological and metabolic status of the participants, which may have a significant impact on the development of sarcopenia.
statistical analysis
Data analysis was performed using SPSS 29.0 and R 4.0.3 software. Several R packages were used for statistical analysis, including haven (for reading .dta files), tidyverse (for data manipulation and visualization), glmnet (for LASSO regression analysis), ROSE (for implementing oversampling techniques), rms (for creating calibration plots), pROC (for ROC curve analysis), and caret (for training machine learning models). Missing data were handled using a complete case analysis approach. Participants with missing data on variables required for CKD diagnosis (serum creatinine for eGFR calculation, self-reported renal disease status) or sarcopenia assessment (anthropometric measurements for muscle mass calculation, grip strength measurements, gait speed, chair-stand test results) were systematically excluded from the analysis. Additionally, participants with missing data for covariates included in the final predictive model were excluded using listwise deletion (na.omit() function in R). This approach ensures that all participants included in the analysis have complete data for all variables of interest and maintains the integrity of the statistical modeling process. The assumption underlying this approach is that data are missing completely at random (MCAR) or data are missing at random (MAR).
In the data preprocessing stage, we adopted a strict sample splitting strategy by randomly assigning 1,000 samples. 70% of it was used for the training set and the remaining 30% was used for the internal validation set. This split was performed to ensure that the training set was representative of the entire population, allowing for robust model training and validation. CHARLS 2011 data was used as an external validation set for this study to reduce the overfitting effect due to oversampling. The statistical analysis assumed that continuous variables (including age, weight, height, blood pressure, grip strength, walking speed, sleep duration, waist circumference, and various biomarkers) followed a normal distribution, which provided the theoretical basis for the application of parametric statistical methods. First, descriptive statistics were performed on all collected variables. Continuous variables were expressed as mean ± standard deviation (mean ± SD), and categorical variables were expressed as frequency and percentage. Comparisons between groups were performed using t-tests, chi-square tests, or nonparametric tests, depending on data type and distribution characteristics. We then utilized least absolute shrinkage and selection operator (LASSO) regression to identify independent risk factors and build a sarcopenia risk prediction model. LASSO is suitable for high-dimensional data because it prevents overfitting by shrinking coefficients and selecting the most predictive features. All candidate variables were included in the LASSO regression. Feature selection was performed using 10-fold cross validation to select variables with non-zero coefficients to determine the optimal tuning parameter (λ). The goodness of fit of the model was assessed by the Hosmer-Lemeshow test, and the discriminatory power was assessed by the subject task characteristic curve (ROC curve) and the area under the curve (AUC). Furthermore, the clinical utility of the model was evaluated using a calibration curve and decision curve analysis (DCA). All statistical tests are two-sided; P<0.05 was considered statistically significant.


