Clinical characteristics of PCBM patients
This research encompassed a cohort of 30,034 qualified patients diagnosed with PCBM, sourced from the SEER database. Baseline characteristics are detailed in Table 1 and analyzed as follows: The median age of the patients was 70 years, with 492 patients (1.64%) younger than 50 and 8,163 (27.18%) older than 80. In relation to race, 74.91% of the patients identified as white. Treatment initiation varied among the patients, with 17,537 (58.39%) receiving therapy more than a month post-diagnosis, while 12,497 (41.61%) sought immediate medical intervention. Adenocarcinoma was the predominant histopathological type (83.15%). The distribution of tumor staging ranged from T1 to T4, with proportions of 9.31%, 11.35%, 3.56%, and 5.29%, respectively; while N0 and N1 staging constituted 22.58% and 10.62% of cases, respectively. Notably, 34.53% of patients exhibited tumor progression to grade III, with a mere 0.39% presenting with grade I. For Gleason scores, 8.49% of the patients had scores ≤ 7, 13.77% had scores of 8, 28.22% had scores of 9, and 6.29% had scores of 10. Regarding PSA levels, 81.75% of the patients had levels greater than 10 ng/ml. Treatment modalities varied, with 9.65% undergoing surgery, 14.79% receiving chemotherapy, and 22.48% undergoing radiotherapy. The proportions of liver metastases, brain metastases, and lung metastases were 3.83%, 1.03%, and 8.09%, respectively. Concerning marital status, 55.14% of the patients were married, while 18.00% were single. For median household income, approximately 43.77% exceeded $75,000. The training and test sets showed no significant differences in baseline characteristics (all p > 0.05, Table 1), confirming the validity of the random division method. We further analyzed the impact of different treatment combinations on the survival of patients with prostate cancer bone metastasis (PCBM).
COX regression analysis
The COX regression analysis results are shown in Table 2. The univariable Cox regression analysis identified all examined variables, including age at diagnosis, race, months to treatment, histological type, T stage, N stage, tumor grade, Gleason score, PSA level, distant metastases (liver, brain, lung), treatment modalities (surgery, radiotherapy, chemotherapy), marital status, and median household income, as statistically significant predictors of survival in PCBM patients. The multivariable analysis revealed that age over 70, delayed treatment, advanced T stage, lymph node metastasis, high tumor grade, elevated Gleason score, and PSA levels above 10 ng/mL were independent risk factors for poorer survival. Socioeconomic factors were also significant, with single patients having a heightened risk of mortality (HR = 1.23, 95% CI 1.19–1.27, p < 0.001), and those with a median household income above $75,000 showing a lower risk of death (HR = 0.87, 95% CI 0.85–0.90, p < 0.001). The univariate Cox regression analysis showed that surgery (HR = 0.90, 95% CI: 0.86–0.94, p < 0.001), chemotherapy (HR = 0.75, 95% CI: 0.72–0.79, p < 0.001), and radiotherapy (HR = 0.86, 95% CI: 0.84–0.89, p < 0.001) were significantly associated with improved survival in PCBM patients. Supplementary Table S1 further shows that Only Surgery had the longest median survival (52.0 months, 95% CI: 47.0–56.0 months) among single modalities, followed by Only Chemotherapy (46.0 months) and Only Radiotherapy (45.0 months, Log-rank P < 0.001 for all comparisons). However, after adjusting for confounding factors in the multivariable model, only chemotherapy (HR = 0.85, 95% CI: 0.81–0.89, p < 0.001) and radiotherapy (HR = 0.96, 95% CI: 0.93–0.99, p = 0.032) remained independent predictors. The effect of surgery attenuated to non-significance in the multivariable analysis (HR = 0.98, 95% CI: 0.93–1.03, p = 0.387) (Table 2, Supplementary Table S1). To comprehensively evaluate the performance of the multivariate Cox regression model, we calculated the c-index for both the training and test sets. The model demonstrated a c-index of 0.715 on the training set and 0.703 on the test set, indicating relatively good discriminatory ability in predicting survival outcomes for PCBM patients. Months to treatment, months from diagnosis to treatment; PSA, prostate specific antigen.
Furthermore, the KM survival curves (Fig. 2) confirmed the impact of these treatment modalities on survival. Chemotherapy demonstrated the most pronounced effect, reducing mortality risk by 24.8% (HR = 0.75, 95% CI 0.72–0.79, p < 0.001), followed by radiotherapy with a 13.6% reduction (HR = 0.86, 95% CI 0.84–0.89, p < 0.001) and surgery with a 10.2% reduction (HR = 0.90, 95% CI 0.86–0.94, p < 0.001). Supplementary Fig. S1 extends this analysis through a subplot design: Panel A confirms the survival advantage of Only Surgery among single therapies (Log-rank P < 0.001), Panel B shows overlapping curves for dual combinations (chemotherapy + radiotherapy, surgery + chemotherapy, surgery + radiotherapy; P = 0.079), and Panel C contrasts Triple Modality (n = 120, median survival 31.0 months) with Non-Triple Modality (n = 12,312, median survival 46.0 months), revealing a non-significant trend (HR = 1.23, P = 0.125). As noted in Supplementary Fig. S1 and Table S1, the 16.8-fold sample size imbalance between Only Surgery (n = 2,013) and Triple Modality (n = 120) may have influenced these results.

Kaplan-Meier survival curves for PCBM patients by treatment modality (A: Chemotherapy, B: Radiotherapy, C: Surgery).
Evaluation of prognostic models
Key hyperparameters were identified and tuned to produce the optimal model, as summarized in Table 3. ROC curves were constructed, and corresponding AUC values were computed for both the training and test sets to evaluate the model’s performance in predicting 1-, 3-, and 5-year survival (Fig. 3). The XGBoost model achieved robust performance in predicting survival for PCBM patients at 1-year (test set: AUC = 0.76), 3-year (test set: AUC = 0.83), and 5-year intervals (test set: AUC = 0.91). These results outperformed traditional machine learning algorithms: Logistic Regression (1-year: AUC = 0.71; 3-year: AUC = 0.75; 5-year: AUC = 0.85), Random Forest (1-year: AUC = 0.75; 3-year: AUC = 0.82; 5-year: AUC = 0.90), Support Vector Machine (1-year: AUC = 0.62; 3-year: AUC = 0.60; 5-year: AUC = 0.77), k-Nearest Neighbors (1-year: AUC = 0.69; 3-year: AUC = 0.68; 5-year: AUC = 0.88), and ID3 Decision Tree (1-year: AUC = 0.73; 3-year: AUC = 0.80; 5-year: AUC = 0.89) (Table 4). The results of the performance of machine learning-based prognostic models on the train data can be found in Table 5. To ensure model robustness, a five-fold cross-validation approach was utilized in the training set for iterative refinement. The results of the five-fold cross-validation for different machine learning – based prognostic models are presented in Table 6.

Receiver operating characteristics curve (ROC) of the extreme gradient boosting model for predicting 1-year, 3-year and 5-year survival in the training set and test set, respectively.
The accuracy and precision of the XGBoost model were further assessed through a confusion matrix. The 1-year survival prediction model achieved an accuracy of 0.775 and a precision of 0.618 (Fig. 4A); the 3-year survival model reached an accuracy of 0.827 and a precision of 0.651 (Fig. 4B); the 5-year survival model obtained an accuracy of 0.965 and a precision of 0.714 (Fig. 4 C).

Confusion matrices of (A)1-year, (B)3-year and (C)5-year survival predicted by the extreme gradient boosting (XGBoost) model in the test set.
The DCA curves, illustrated in Fig. 5, demonstrate the broad range of threshold probabilities and the favorable net benefits of the XGBoost model for predicting survival at 1-, 3-, and 5-year intervals. The results demonstrate that the XGBoost model consistently outperformed both the ‘all-treatment strategy’ and the ‘no-treatment strategy’ across a wide range of threshold probabilities. This finding underscores the clinical utility of the model in enhancing decision-making for patient survival predictions.

Decision curve analysis (DCA) curves of (A)1-year, (B)3-year and (C)5-year survival predicted by the extreme gradient boosting (XGBoost) model in the training set. DCA curves of (D)1-year, (E)3-year and (F)5-year survival predicted by the XGBoost model in the test set.
Interpretability analysis of the XGBoost prediction model
Our interpretability analysis revealed that key factors such as T stage, age at diagnosis, Gleason score, PSA level, and grade significantly influence patient outcomes. T stage consistently emerged as the most significant predictor for both short-term (1-year) and long-term (5-year) survival, as shown in Fig. 6A and C. In contrast, grade had a more pronounced impact on intermediate-term survival (3-year), as depicted in Fig. 6B. SHAP value analysis (Fig. 7) further emphasized the critical role of T stage across different prognostic timelines, with age at diagnosis also consistently influential. Additionally, while the grade dominated the 3-year prognostic model, Gleason score and PSA levels showed variable importance across different periods. These findings highlight the dynamic nature of clinical feature significance over time, enhancing the models’ clinical applicability and interpretability.

The extreme gradient boosting (XGBoost) prediction model’s feature importance ranking for predicting (A)1-year, (B)3-year, and (C)5-year survival.

SHAP Values for Predicting (A)1-year, (B)3-year, and (C)5-year Survival in Patients with Prostate Cancer Bone Metastasis (PCBM).
Figure 8 shows the SHAP force plots for the 1-, 3- and 5-year survival probability predictions of a randomly selected sample from the test set. Each force plot begins from a baseline value, which is the average of all predictions. Predictive factors (and their respective Shapley values) are shown with arrows—red indicating factors increasing the prediction, blue indicating factors decreasing it. The length of the arrow signifies the relative importance of the factor. In addition, the values of the features are listed at the bottom, and the final predicted output of the model is shown at the intersection of red and blue arrows. For the 1-year survival prediction (Fig. 8A), the base value is −0.9659, with a final predicted survival probability of 0.66. Features such as “Chemotherapy = 1,” “T Stage = 0,” “Age at Diagnosis = 22,” and “Gleason Score = 5” show positive contributions (red arrows toward “higher”). These suggest that receiving chemotherapy, having an earlier T stage, younger age at diagnosis, and a lower Gleason score value improve short-term survival. Conversely, “PSA = 973” has a negative impact (blue arrow toward “lower”), indicating that elevated PSA levels correlate with poorer outcomes. In the 3-year survival prediction (Fig. 8B), the base value shifts to −1.663, and the predicted survival probability decreases to 0.49. Positive contributions persist for “Chemotherapy = 1,” “Age at Diagnosis = 22,” and “Gleason Score = 5” (red arrows). The absence of lymph node involvement (“N Stage = 0”) and “Grade = 1” also emerge as significant positive factors (red arrows), underscoring their combined impact on mid-term survival. For the 5-year survival prediction (Fig. 8C), the base value drops to −2.812, and the predicted survival probability plummets to 0.09. Protective factors like “Marital Status = 1,” “Grade = 1,” “Age at Diagnosis = 22,” and “Gleason Score = 5” still show positive contributions (red arrows) in the early segments but are gradually overshadowed by dominant negative factors: “T Stage = 0,” “N Stage = 0,” “PSA = 973,” and “Months to Treatment = 0” (blue arrows). This shift highlights how the cumulative impact of adverse clinical features can override initial protective effects over the long term, leading to a very low predicted survival probability.

SHAP force plots for a randomly selected sample from the test set, showing the predictions of 1-year (A, Probability: 0.66), 3-year (B, Probability: 0.49), and 5-year (C, Probability: 0.09) survival probabilities. Red feature arrows pointing toward “higher” indicate factors increasing the predicted probability, while blue arrows toward “lower” indicate factors decreasing it. The horizontal axis displays SHAP values of features and their cumulative impact on the prediction. “Base value” denotes the baseline (average prediction), and “f(x)” represents the final predicted survival probability for the sample.
Development of Web-Based application
In order to facilitate the utilization of our prognostic models by researchers and clinicians, we designed a user-friendly web application utilizing Streamlit technology. The web interfaces (Fig. 9) allow users to input relevant clinical features for a new sample, enabling the application to generate survival probability predictions at 1, 3, and 5 years for individuals with PCBM. Additionally, based on the predictive results, the application provides corresponding diagnostic recommendations to assist healthcare professionals in making more informed clinical decisions.
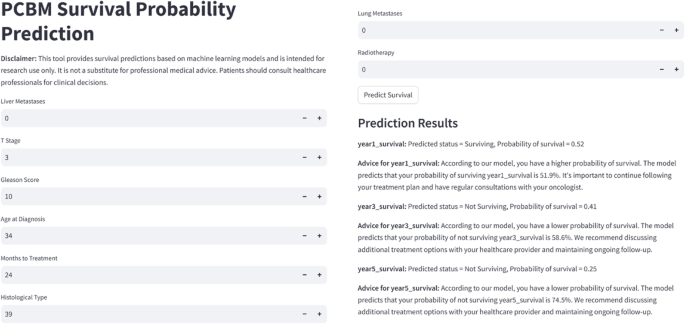
Screenshot of web app (https://onlinelitemodel4pcbm.streamlit.app/).