
Virtual forward synthesis (VFS) reactions
As stated previously, in the pursuit of our design goals, we narrowed our focus to ROP polymers, because of their potential to meet the requisite thermodynamic criteria for facilitating chemical recycling to monomers20,21. The polymer should undergo depolymerization into its monomer ring form above its Tc, while remaining stable in polymer form below it.
To initiate the search for viable polymer candidates, we employ a VFS approach. This method involves the systematic generation of hypothetical polymers from a database of initial monomers, following established reaction pathways. Although the technique dates to the early 2000s26, recent advancements in this area, exemplified by initiatives such as the Open Macromolecular Genome, SMiPoly, and polyVERSE27,28,29, have underscored the potential of this methodology when integrated with ML. Unlike these predecessors, our approach places a significant emphasis on database design, as detailed in the “Database and molecule data” section, and supports the integration of multi-step reaction pathways.
Figure 2 depicts a high-level flowchart of the VFS procedure. Our technique interfaces heavily with a database, as can be indicated by the database icons within the figure, indicating when data is stored. Our workflow begins with a computational chemist creating a virtual reaction using reaction smarts from known reaction pathways.
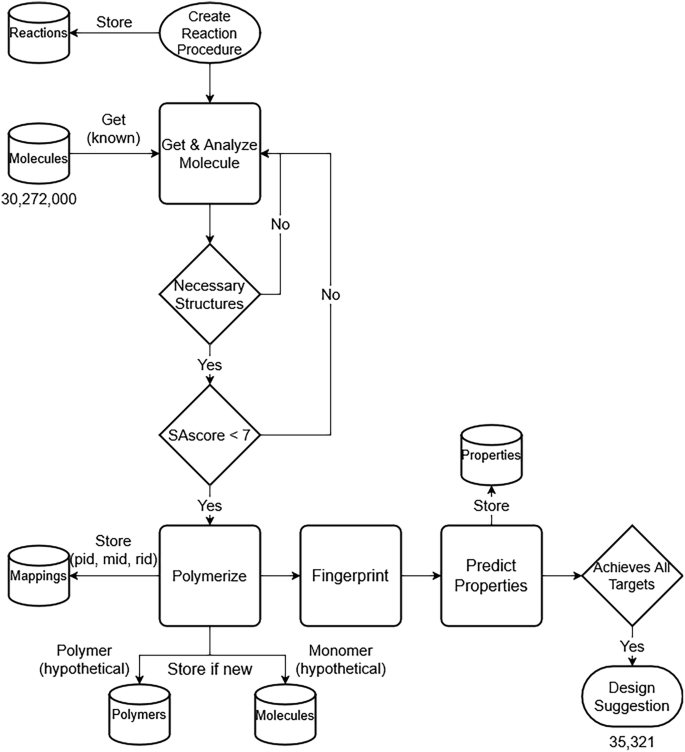
Flowchart of the VFS design workflow. Arrows indicate the direction of data flow. Cylindrical elements represent database tables accessed during the process. A total of 30,272,000 molecules were analyzed, yielding 35,321 polymer designs.
Within our database, a structured query language (SQL) table houses the simplified molecular-input line-entry system (SMILES) of both known and hypothetical molecules. Known molecules were gathered from multiple sources, including ZINC15, ChemBL, compounds sourced from literature, eMolecules, and VWR30,31,32,33. During each VFS reaction procedure, we search this repository for known molecules possessing the required substructures via SMILES arbitrary target specification (SMARTS) substructure queries34. Subsequently, to ensure synthetically tractable molecules, we apply a stringent filter, excluding those with a synthetic accessibility score (SAscore) above 7, which is substantially higher than the average score of approximately 3 commonly observed for synthetic molecules.
We selected the SAscore as an initial screening metric due to its well-established validation on a large corpus of synthesized molecules, high computational efficiency, and seamless integration with RDKit. This score is calculated by incorporating penalties for atom count, chiral center count, and ring complexity (including spiro and bridge atoms). Notably, the RDKit implementation also accounts for molecular symmetry, rewarding highly symmetrical structures with lower scores, which are indicative of enhanced synthesizability. Although our focus on ringed monomers was expected to yield higher scores on average, due to the inherent penalties associated with ringed motifs, we deemed this metric suitable for preliminary filtration due to its efficiency advantages over more computationally expensive fingerprinting techniques, which can be prohibitively slow for complex molecules (https://www.rdkit.org/)35,36.
Following this filtration process, we subject the retained molecules to the reaction procedure to generate virtual polymers (denoted by the polymerize process in the flowchart). Additionally, for multi-step reactions, we generate virtual monomers, essential for ΔH predictions. Subsequently, both monomers and polymers are converted to SMILES format and subjected to canonicalization, ensuring that molecules with the same structure output the same string37. For example, polyethylene can be encoded as “[*]CC[*]” and “[*]C[*]” and canonicalization will ensure these are both recorded as “[*]C[*]”. This canonicalization step is crucial for database querying efficiency, as it enables us to perform string comparisons on the canonical_smiles column in O(log(n)) search complexity due to B-Tree indexing. This allows us to assess if the polymer is “known” already or “hypothetical”. While RDKit’s CanonSmiles function is used for monomer canonicalization (https://www.rdkit.org/), the canonicalize_psmiles package18,38 serves this purpose for polymers.
We query the molecules table for the monomer’s molecule ID (mid in the flowchart) and the polymers table for the polymer ID (pid in the flowchart). If a monomer or polymer already exists within our database, we extract its ID. Otherwise, we will add it to the database with a unique ID and flag it as a “hypothetical” structure. If the monomer or polymer already exists within the database, it will have been flagged as “known” if it originated from literature reviews, database dumps, or previous experimental characterization, or “hypothetical” if it was generated through our VFS technique and not corroborated by existing literature or experimental data. Upon identification or generation of IDs, a mapping table is used to store the pertinent associations among molecule ID, reaction procedure ID (rid in the flowchart), and polymer ID. This facilitates the swift retrieval of reactants necessary for promising polymer synthesis, alongside the proposed reaction pathway. The identification of promising polymers entails fingerprinting the polymers (and monomers for enthalpy predictions) and then leveraging ML techniques to predict their properties and subsequently evaluating them against predefined screening criteria, as identified in Fig. 1c. The efficiency of virtual polymerization, canonicalization-enhanced databasing, and ML has shifted the bottleneck to fingerprinting, which requires approximately 1000 compute seconds to process 10,000 polymers. We estimate this step is at least an order of magnitude slower than the combined time of the other processes18.
In Table 1, a simplified version of the ROP reaction is displayed, along with the class of monomer ring being opened, the number of polymers generated from each class, and how many successfully met all target criteria. Our investigation encompasses ring-opening reactions of ethers, thioethers, esters, thioesters, thionoesters, amides, cycloalkenes, carbonates, and thiocanes. For cycloalkenes, we assume the polymerization and depolymerization process would occur through a ring-opening metathesis reaction39. For thioethers, thioesters, and thionoesters, in addition to exploring commercially available options, we also explored hypothetical monomer designs by swapping the appropriate oxygen in an ether or ester with a sulfur. This approach resulted in a substantially larger explored chemical space than would be expected from a sole search of these structures in the database.
Similarly, for thiocanes, because so few commercially available molecules with the thiocane structure existed, we developed a two-step reaction procedure guided by the expertise of our polymer chemists. This two-step procedure had two variants, R1 and R2, as outlined in Table 1. The variants differ in their functionalization step: R1 involves modifying the vinyl sulfide’s vinyl component with a terminal alkyne-containing molecule, whereas R2 involves functionalizing the ring’s ketone component with a bromine-containing molecule. Notably, both the alkyne and bromine groups are eliminated during this initial reaction step, leaving behind the R-group attached to the thiocane. The resulting thiocane can be either the R1 or R2 variant, but not both. Both variants undergo ring-opening in the second step, yielding a novel polythiocane.
All 30,272,000 molecules in our database were screened using SMARTS to assess if they contained specific substructures relevant to our reaction procedures, as outlined in Table 1. For example, 2,321,545 molecules contained the ether ring structure (SMARTS of “[C; R; !$(C = O)][O; R][C; R; !$(C = O)]”). These molecules are eligible for use in both our ether-to-polyether ring-opening reaction procedure and the ether-to-thioether-to-polythioether ring-opening reaction procedure. From the 30,272,000 molecules, we generated a total of 7,301,681 polymers using nine distinct classes of reaction procedures. The full list of necessary substructures searched using SMARTS can be found in the “reaction_procedures.json” located on the GitHub page linked in the “Fitness assessment” section. This file contains detailed single and multi-step reaction procedures, which constitute the structures searched for within each molecule using SMARTS nomenclature, the step at which the monomer is generated (if distinct from the initial molecule), and the reaction SMARTS employed at each step. For additional details on the database schema and VFS, refer to the Supplementary Section “VFS and the Database Schema”. For a detailed example of creating reaction procedures and multi-step reactions, see the example presented in Supplementary Fig. S14 and the corresponding lines 251–299 of “reaction_procedures.json”, as well as the “Reaction procedures” section.
Predictive models
Polymers generated in this study had their properties predicted using two subsets of previously developed and published models18,19, as described in the “Predictive models for polymer properties: Gaussian process regression and multitask neural network” section: a Gaussian process regression (GPR) model to predict ΔH based on the polymer and monomer19, and a multitask neural network (MTNN) trained on homo and copolymer data to predict all other properties18. Parity plots illustrating the MTNN models’ performance on test data of known polymers (red dots) and our dataset of known ROP polymers (black stars) are depicted in Fig. 3. The count and root mean squared error (RMSE) shown represents firstly the test dataset size and model performance on the test data, then on the known ROP polymers. For ΔH, the black stars and labeled RMSE and count indicate the performance on test ROP data and the size of the test dataset, while the colored circles represent the training data.

Parity plot illustrating model performance across different properties. The first set of values in the top left showcase counts and RMSE on the model test data of known polymers, which are represented by red circles. The second set delineates the dataset size and model performance specifically on known ROP polymers, denoted by black stars. For the enthalpy of polymerization, dots depict training data, while black stars indicate test data, as the model was exclusively trained on ROP polymers.
With the exception of ΔH, the models generally perform worse for known ROP polymers than their known test dataset chemistries. This outcome is unsurprising given the limited variety of ROP chemistries in the original training data. Of the 138 unique ROP polymers with thermal property data available, only eight were seen in the training data, and of the twenty with mechanical property data available, none were in the training data. However, predictions for thermal properties tend to align closely with the parity line, indicating acceptable performance. In contrast, for mechanical properties, the models tend to over-predict performance. In addition to the lack of ROP data, this discrepancy could be attributed to the training process, as the models only consider molecular structure, while factors such as molecular weight, which contribute significantly to mechanical properties, are not considered. It is possible that while the ROP molecular structure enhances strength, the molecular weight remains insufficient40. Unfortunately, due to the scarcity of reliable datasets that include molecular structure, mechanical property values, and molecular weight, we were unable to train a machine learning model that effectively utilizes molecular weight information. The predicted mechanical properties should thus be viewed as a stochastic average over morphological and molecular weight variations, and should be used as a guide that points us in the right direction.
This observation is supported by two outlier polymers in the σb plot. These outliers exhibit predicted values of 58 and 77 MPa, whereas their actual values are 3.4 and 3.1 MPa, respectively. Notably, the molecular weights associated with these polymers are very low at 18 and 10.8 kDa, compared to other ROP polymers in the dataset, which range from 109–126 kDa (44 MPa), 198 kDa (39 MPa), to 266–438 kDa (46.4 MPa)21,41,42.
Similarly, in the case of E, one outlier exhibits a predicted value of 2.07 GPa, while its true value is 0.17 GPa, with a low molecular weight of 18 kDa21. However, this theory fails to account for some other inaccuracies of the model, as evidenced by two other polymers with predicted values of 2.44 and 2.08 GPa. Their true values were considerably lower at 0.45 and 0.64 GPa, despite higher molecular weights of 85.6 kDa and 69.3 kDa.42,43. These instances suggest that the model has not encountered enough similar chemistry.
Figure 4 shows the histograms representing the distribution of the predicted polymer properties for the entire pool of over seven million hypothetical ROP polymers generated here (green), as well as for the measured properties of presently known ROP polymers (black). Note that the y-axis is on a log scale. Based on Fig. 4, it can be concluded that existing ROP polymers generally have low mechanical and thermal properties. In contrast, our models predict that many hypothetical ROP polymers could potentially surpass these limitations, achieving higher performance values.

Histograms illustrating predicted property distributions for hypothetical ROP polymers (green) and measured property distributions for known ROP polymers (black).
Promising polymers
To determine which hypothetical polymers are most promising, we employed a three-step fitness function defined mathematically in the “Fitness assessment” section. This assessment multiplies scaled property predictions, each normalized between zero and one, to compute a polymer’s fitness score. The scaling ensures that properties with different units and scales, such as Tg and Cp, are treated equally, preventing any one property from dominating the fitness score due to its magnitude. We chose a multiplicative approach to emphasize the importance of meeting all target properties, as a single property falling short can significantly impact the overall performance of the polymer. Polymers achieving a perfect fitness score of one met all predefined property requirements. The fitness distribution among the polymers and their classes is illustrated in the stacked bar plot in Fig. 5a.

a Histogram illustrating the distribution of fitness values among hypothetical polymers (left) and a count plot for polymers achieving fitness score >0.8 for each monomer class (right). b Uniform manifold approximation and projection (UMAP) visualization of high-dimensional polymer fingerprints condensed into two dimensions, with class colors matching (a) and (b) to indicate target-achieving polymers. The stars correspond to the bottom three polymers shown in Table 2.
The multiplicative approach employed in our fitness assessment heavily penalizes polymers that significantly fall short of achieving a single property or moderately miss multiple targets. This enables us to prioritize polymers that most closely match all target properties, even when not all properties are perfectly met. The effect of this approach is reflected in the right-skewed distribution of polymer classes in the left plot of Fig. 5a, characterized by a sharp decline at 0, a gradual decrease between 0.2 and 0.4, and a more pronounced drop-off thereafter. Furthermore, due to the capping of values above the target at 1, a clustering of polymers at the maximum fitness value of 1 is observed.
To account for modeling errors, we established a fitness score threshold of 0.8 to identify promising polymer candidates. Despite generating millions of polymers, only 817 achieved all property targets, while 35,321 met the 0.8 cutoff, underscoring the intricate challenge of designing polymers with multiple desired properties. The successful polymers were predominantly thioethers, ethers, and amides, with smaller subsets of cycloalkenes, thionoesters, thioesters, esters, and a negligible number of thiocanes and carbonates, as can be seen in the right plot of Fig. 5a. However, amides, esters, thionoesters and carbonates exhibited a higher frequency of meeting the target criteria, relative to their representation in the population, as shown in Table 1.
We visualized the high-dimensional polymer fingerprint, as described in the “ Fingerprinting techniques for polymers and molecules” section, using a UMAP (see the “Uniform manifold approximation and projection (UMAP)” section for an overview of the method)44. Employing a cosine similarity metric, we configured the UMAP with 200 nearest neighbors and a minimum distance setting of 0.25, optimizing for a balance between local and global manifold structures and ensuring adequate spacing of data points45. The result is shown in Fig. 5b. Known ROP polymers are denoted by green circles, while known ROP polymers achieving the desired fitness score, discussed in the “Synthetic validation & design guidelines” section, are marked with colored stars. Hypothetical ROP polymers achieving the fitness score are represented by colored plus symbols, contrasting with the gray x’s representing other hypothetical ROP polymers. The color scheme for stars and plus symbols in (b) corresponds to the class colors in (a), facilitating intuitive comparison.
The UMAP visualization unveils discernible clusters, particularly noticeable on the upper right side, where hypothetical polymers exhibit substantial deviations from current ROP chemistries, hinting at uncharted realms with untapped potential. However, given that these chemistries are novel to the model, the extrapolation may not be accurate. Therefore, we recommend validating these predictions using more rigorous computational models, such as DFT, before pursuing experimental synthesis. On the other hand, there are some promising polymers situated near established ROP domains, particularly in the left portion of the map. This proximity suggests the existence of novel candidate polymers that may be able to effectively leverage known ROP reaction catalysts, solvents, and temperatures.
To comprehensively examine the distinct properties of the polymer classes, we devised radar plots for each category, as depicted in Fig. 6. Within each plot, the shaded region delineates the minimum to maximum range of predicted properties for the polymer class and the solid lines represent the properties for ten randomly chosen polymers achieving the fitness threshold within the class. Additionally, the predicted properties for known ROP polymer within a class are colored gold.

Radar plots showcasing ranges for Cp (J (g*K)−1), ΔH (kJ/mol), Tg (K), Td (K), σb (MPa), and E (GPa) of different polymer classes. Each shaded area delineates the minimum to maximum range of predicted properties within the respective polymer class, while the orange line denotes the targeted design region. Additionally, individual lines trace ten randomly chosen polymers that successfully meet the fitness objective (>0.8). The gold lines in the ‘Amide`, ‘Ester̀, and ‘Thiocane` charts delineate the predicted properties for the known ROP polymers within these classes that achieved the fitness objective.
The plot reveals that the majority of polymers hover around or slightly exceed the target thresholds for each property. Notably, some polymers excel in specific properties like E or Tg, while barely meeting the other targets. Conversely, a subset of polymers falls short of the target region for certain properties, particularly ΔH. However, these deviations are marginal, and therefore, the fitness function imposes only minimal penalties.
Table 2 showcases a selected group of hypothetical polymers that achieved all targeted properties, along with their predicted properties. The corresponding reactant monomers and polymer repeat units are illustrated in Fig. 7. A common structural motif among all promising polymers is the presence of cyclic elements within their backbones or substituents, which is known to enhance polymer rigidity and consequently improve thermal stability, stiffness, and strength46,47. In our dataset of known polymers, we see a statistically significant upward shift in the histograms of Tg, E, and σb for polymers with either aliphatic or aromatic rings. Moreover, there is a notable further shift toward higher values when these rings are incorporated within the backbone, as illustrated in Supplementary Fig. S1. For the hypothetical polymers, those with the ring in the backbone also tended to have higher Tg.
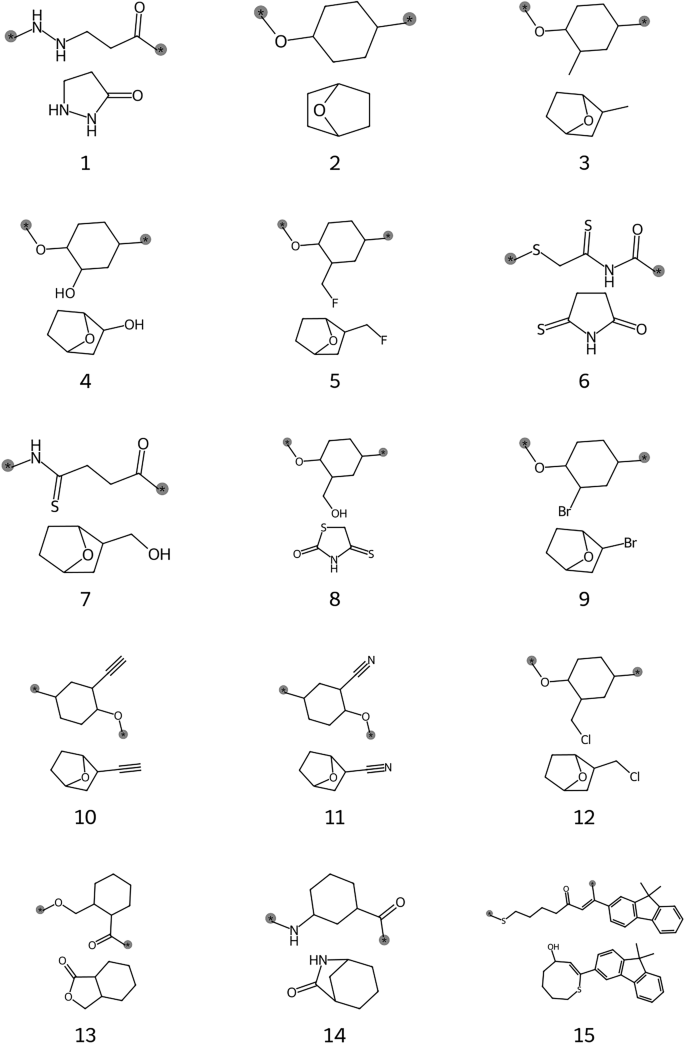
Polymer (top) and monomer (bottom) structures for promising candidates, labeled with corresponding IDs from Table 2. Polymer bonding locations are indicated by gray-highlighted stars.
Among the 35,321 selected polymers, only 416 lacked any ring structures entirely. Notably, 323 of these polymers featured alcohol, (thio)imide, or amide moieties with no or short substituents attached to the polymer backbone. We hypothesize that the observed enhanced performance of these interesting cases may stem from the potential for hydrogen bonding within these structures. Indeed, hydrogen bonding has been recognized to augment mechanical properties by promoting inter-chain interactions that enhance polymer rigidity48,49,50,51,52, so long as intrachain bonding that can increase chain flexibility is avoided50. Moreover, substituents and side chains are known to influence polymer properties significantly. Increasing their size typically leads to greater free volume and reduced packing density, factors known to lower both the Tg and mechanical strength53,54.
Mirroring the stiffening trend observed in ring-containing polymers, we once again noted a rightward shift in the histograms depicting the property distributions of known polymers containing nitrogen, as shown in Supplementary Fig. S2. While the presence of amines and amides seemed to have little impact on mechanical properties, thermal properties saw a small effect. Furthermore, both categories of properties exhibited a statistically significant rightward shift when featuring an imide structure. In general, we observed that an increase in the number of hydrogen-bond acceptor atoms in the chain corresponded to an increase in both properties, as seen in Fig. S2c. Moreover, a distinct positive correlation between Tg and σb was discerned in our experimental dataset, as illustrated in Fig. S3. This is likely because both properties are influenced by chain stiffness.
The downside to functional groups that induce hydrogen bonding, however, is their tendency to be inherently reactive. Chemical intuition dictates caution against the inclusion of amines, hydroxyls, carboxylic acids, and acidic methylene groups in the monomer structures. While these groups have the potential to enhance thermal and mechanical properties through hydrogen bonding, their high reactivity could lead to undesirable side reactions during synthesis, ultimately diminishing the likelihood of successful ring-opening polymerization. Filtering out molecules containing these functional groups yields a list of 6477 promising polymer candidates.
Synthetic validation & design guidelines
Our design process identified two previously known polymers (IDs 13 & 14) as potential candidates to replace PS (these were not part of the training set used to create our non-enthalpy property prediction ML models). Significantly, both featured rings in their backbone structures, with one additionally incorporating an amide moiety. Polymer 13 was synthesized from a Γ-butyrolactone derivative and successfully met all target properties except for the Cp, which was not determined, and the Tg, which we predicted to be 393 K but was measured at 322 K. The deviation in Tg could potentially be attributed to the polymer’s low crystallization rate or variations in stereochemistry that are not adequately represented by the models55. The other values listed were a ΔH of −20 kJ/mol, a Td of 613 K, a E of 2.7 GPa, and a σb of 54.7 MPa, all slightly higher than our model predictions, but close.
For polymer 14, experimental measurements revealed a Td of 630 K and a Tg spanning from 419 K to 472 K. Impressively, the polymer demonstrated outstanding chemical recycling capabilities, boasting a remarkable mass recovery rate of 93–98%. Moreover, upon copolymerization with nylon 4, it achieved an impressive E value of 2.28 GPa. Although literature lacks information regarding its Cp or σb, the other properties were consistent with both our predictions and design targets56.
The discovery of these polymers marks a compelling initial validation of our informatics-based approach. Moreover, they exhibit chemical motifs akin to other polymers flagged by our models. This promising discovery bodes well for unveiling more mechanically and thermally resilient, chemically recyclable polymers (poised to serve as ideal substitutes for PS) within our catalog.
In addition to the above “designed” candidates previously identified in the literature, we endeavored to synthesize the other promising, entirely new candidates. Focusing on the thiocane class, we selected one functionalized with an alkyne-containing, comparatively low-cost dimethyl fluorene, polymer 15 in Table 2. In selecting this candidate, we utilized polymerization efficacy heuristics; dimethyl fluorene lacked additional functional groups that could potentially disrupt the polymerization process. The polymer was synthesized according to the procedure outlined in the Supplementary Section “Thiocane Synthesis” and our recent publication57. Excitingly, the Td of the synthesized polymer met our target, and while the Tg did not fall precisely within our desired range, it reached 352 K—only 27 K lower than the predicted value of 379 K. This discrepancy between predicted and measured values may be attributed to the polymer’s relatively low molecular weight (6 kDa), suggesting potential improvement with higher molecular weights based on the Flory-Fox equation.
Unfortunately, we encountered difficulties during the polymer synthesis. Low yield in monomer preparation posed an initial challenge, limiting our ability to produce sufficient quantities of monomer for polymerization. Additionally, we were unable to exceed a molecular weight of 6 kDa as a result of solubility problems, which hindered measurements of mechanical properties. Despite numerous adjustments to the polymerization solvent, these challenges persisted. Nonetheless, this experience serves as robust validation of the VFS technique and underscores the inherent complexity of translating polymer “design” to polymer synthesis57. Among thousands of designs, only a select few are predicted to achieve the requisite property targets, and fewer still prove viable for synthesis due to potential interference from certain functional groups in the reaction pathway. Even when a viable candidate shows initial promise, achieving high monomer yields and large polymer molecular weights remains a formidable task. Thus, although employing informatics approaches may not lead to an immediate synthesizable hit, it can be instrumental in prioritizing efforts.
A comprehensive catalog of the promising polymers, along with their predicted properties, precursor materials, and suggested synthesis routes, is provided in Supplementary Materials. Typically, the most promising candidates exhibit the following characteristics:
-
1.
Preference for the heterocycle being opened to have a size of 4, 5, 6, or 7. These comprised 6%, 46%, 35%, and 11% of the down-selected polymers, respectively.
-
2.
Presence of rings within the backbone structure, observed in 64% of down-selected polymers.
-
3.
Inclusion of rings somewhere in the polymer structure (either the backbone or side groups), with 99.3% of down-selected polymers meeting this criterion.
-
4.
Absence of side chains or presence of short substituents or those containing bulky rings.
-
5.
Ability to hydrogen bond (however, care is needed to ensure the bonding group does not interfere with the polymerization chemistry).


