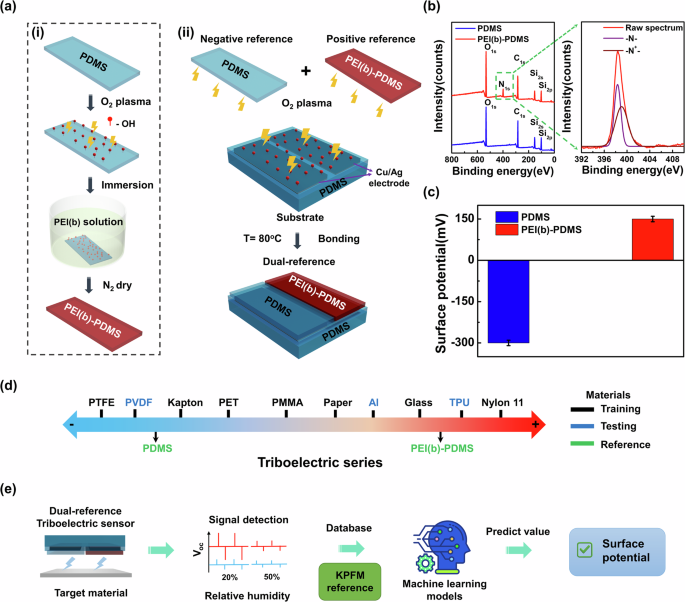
Figure 1a illustrates the fabrication process of the dual-reference triboelectric sensor. Two thin poly PDMS slabs (thickness: 100 µm) were first prepared. To create a positive reference surface, one of the layers was surface-functionalized to induce positive triboelectric behavior by O2 plasma treatment, followed by immersing it in PEI(b) solution. To maximize surface functionalization, the process was optimized (Supplementary Fig. 4). The other slab was left untreated, serving as the negative reference. After reference surface preparation, both pristine PDMS and PEI(b)-functionalized PDMS films (with identical dimensions) were treated with oxygen plasma treatment (100 W, 50 sccm O2, 2 min) to introduce oxygen-containing functional groups (–OH, –C=O, –COOH) on the surface. These groups enhance hydrophilicity and increase surface reactivity. The treated thin films were then placed onto the substrate, forming covalent siloxane bonds, followed by heat treatment at 80 °C for 2 h to strengthen adhesion. This dual-reference design serves as a physical common-mode filter. It is specifically engineered to mitigate environmental disturbances—such as random electrostatic particles and humidity fluctuations—by capturing differential signal patterns that are intrinsically linked to the material’s surface potential. To confirm the chemical modification, X-ray photoelectron spectroscopy (XPS) was performed. Survey spectra (Fig. 1b) reveal C 1 s, O 1 s, Si 2 s, and Si 2p peaks for both pristine PDMS and PEI(b) functionalized PDMS. Notably, an additional N 1 s peak appears only on the PEI(b)-PDMS surface. Deconvolution of N 1 s reveals peaks at 398.3 and 399.1 eV, corresponding to tertiary nitrogen in the pyrrolidine ring and quaternary ammonium nitrogen in PEI(b), respectively. These results confirm successful PEI(b) functionalization via ester linkages21,22,23,24. The hydrophilicity of the surface was further evaluated by static water contact angle measurements (Supplementary Fig. 5). Pristine PDMS exhibited a contact angle of 92.46 ± 1.59°, but after 2 min O2 plasma treatment and 5 min immersion in PEI(b) solution, PEI(b)-PDMS achieved a contact angle of 24.56 ± 1.25°, indicating improved wettability due to quaternary ammonium groups. Using KPFM, the surface potential of each surface was measured, showing –300 mV for the negative reference (untreated PDMS surface) and +150 mV for the positive reference (PEI(b)-PDMS). Figure 1d illustrates the triboelectric series of all the materials involved in this study, including the reference surfaces of the sensor, the materials used for training, and the materials used for testing. Based on this, it is possible to estimate not only where a material will be negatively or positively charged during friction-induced charge generation, but also the relative increase or decrease of triboelectric outputs. As shown in Fig. 1e, we present a flowchart outlining the surface potential prediction framework based on triboelectric output signals and ML. The system utilizes a dataset comprising triboelectric output voltage signals obtained from the dual-reference triboelectric sensor under two humidity conditions (20 and 50% RH). These signals are mapped to surface potential values measured via KPFM at 20% RH, which serve as consistent labels representing the intrinsic surface potential of each material. This database serves as the foundation for training DL algorithms that analyze the triboelectric output signal patterns to extract material-specific features. Through this process, the models learn the correlation between triboelectric output and surface potential, enabling accurate and scalable prediction of surface potential without direct surface characterization using KPFM.

a Schematic illustration of the dual-reference triboelectric sensor fabrication process:(i) surface functionalization of PDMS using branched polyethyleneimine (PEI(b)) solution, and (ii) O2 plasma-assisted bonding of triboelectric layers onto the substrate. b XPS spectra of the pristine PDMS and PEI(b)-functionalized PDMS, and high-resolution N 1 s spectrum confirming nitrogen incorporation. c Surface potentials of PDMS and PEI(b)-PDMS measured by KPFM. d Triboelectric series of all materials used in this study, including reference layers, training materials, and test materials. e Flowchart of the surface potential prediction framework based on triboelectric signals from dual-reference sensors and deep learning models.
This work employs a triboelectric sensor with dual-reference triboelectric sensing layers to predict the surface potential of materials through contact with the target materials (Fig. 2a). Its operation principle—based on contact-separation mode—is illustrated in Fig. 2b using polyethylene terephthalate (PET) as a representative test material. The cycle involves four steps: (i) PET is initially pressed against both sensing layers, consisting of pristine PDMS on one side and PEI(b)-PDMS on the other side, equalizing the surface charges and resulting in no current flow. (ii) As two surfaces begin to separate, the induced triboelectric charges drive electrons to or from each electrode, restoring equilibrium and producing a voltage pulse. (iii) Once fully separated, no current flows. (iv) When the two layers are pressed back into contact, this triggers a reverse flow of electrons, generating an opposite-polarity pulse. Figure 2c, d show the open-circuit voltage (Voc) signals generated from PDMS and PEI(b)-PDMS, respectively, during contact–separation with the PET surface. Upon triboelectric friction with PET, PDMS becomes negatively charged while PEI(b)-PDMS becomes positively charged, generating Voc pulses of opposite polarity (Supplementary Fig. 6). The Voc amplitude increases with applied normal force: from 0.6 to 4 V on the PDMS-side and from 1 to 3 V on the PEI(b)-PDMS-side as the load increases from 1 to 30 N (Fig. 2d). In contrast, the contact-separation frequency has a negligible impact on peak Voc (Fig. 2e). Signal amplitude also depends on separation distance, with Voc increasing steadily from 2 to ~20 mm before saturating (Fig. 2f). The sensor exhibits rapid response kinetics (21–22 ms) and durability: after 12,500 cycles at 20% RH (2 cm separation, 2 N load), Voc remains essentially unchanged (Fig. 2g). These results confirm the sensor’s simple architecture, facile fabrication, high stability, and fast response, making it a reliable platform for evaluating the charge-exchange behavior of materials upon contact.

a Schematic illustration of the sensor setup for measuring triboelectric output when contacting target materials. b Working mechanism of the dual-reference triboelectric sensor in contact-separation mode against a PET surface. c Output voltage of the PDMS-side (negative reference) in response to varying applied forces during contact with PET. d Output voltage of the PEI(b)-PDMS side (positive reference) under the same force conditions as in (c). e Output voltages of the dual-reference sensor under different contact-separation frequencies. f Output voltage variation with separation distances. g Durability of the dual-reference triboelectric sensor under repeated cycling: (i) Stable output voltages even after 12,500 cycles (2 N, 20% RH). (ii) Enlarged signal profiles at 4, 8, and 12 k cycles demonstrate no signal degradation.
To enable DL-based prediction of material surface potential, we first measured the surface potentials of ten materials used in this study, including two reference surfaces, using KPFM at 20–25% relative humidity (RH), as shown in Fig. 3a and Supplementary Fig. 7. This dataset, later used as the training and testing reference for our DL models (see Fig. 4). Among them, seven training materials (PTFE, Kapton, PET, PMMA, Paper, Glass, Nylon 11) were used for model training, and three (PVDF, Al, TPU (thermoplastic polyurethane)) were reserved for testing. The surface potentials of two references, PEI(b)-PDMS and PDMS, used in the sensor were approximately +150 mV and –300 mV, respectively. Among the target materials, PTFE exhibited the most negative surface potential (–410 mV), while Nylon 11 exhibited the most positive value (+320 mV). The surface potential list generally followed the established triboelectric series25. Next, as shown in Fig. 3b, the polarity and amplitude of the output signals from each reference layer are closely linked to the relative surface potential difference with the contacted reference materials. For instance, when contacting PTFE—a strongly electronegative material—both references PDMS (blue curve) and PEI(b)-PDMS (red curve) become positively charged and generate triboelectric signals of the same polarity, although with different amplitudes. This occurs because PTFE lies farther to the negative end of the triboelectric series and tends to attract electrons from both references. In contrast, when the sensor contacts PET—a material whose surface potential falls between those of the two references— PEI(b)-PDMS still produces a signal of the same polarity with reduced amplitude, while PDMS—being more negative than PET—gains electrons and becomes negatively charged. This results in a reversal of the signal polarity from the PDMS side. The triboelectric output amplitude increases as the surface potential difference between the reference and the contacted materials increases. This trend is clearly demonstrated in Fig. 3c: the output voltage from PDMS (negative reference) is relatively small when in contact with PTFE or Kapton (closer in potential), but significantly higher when contacting Glass or Nylon 11(more distant in potential). A similar trend is observed for PEI(b)-PDMS (positive reference), but in the opposite direction. We then repeated the measurements under elevated humidity conditions (50% RH). As shown in Fig. 3d, a consistent reduction in output voltage was observed for all materials. This is primarily attributed to the adsorption of water molecules on the material surfaces, which introduces charge screening and redistribution effects. These water molecules on the surface hinder efficient charge transfer and separation, thus weakening triboelectric output26. The trend is consistent with previous reports27,28. It should be noted that attributing the triboelectric output solely to the surface potential difference provides an incomplete description of contact electrification. While the surface potential establishes the initial driving force for charge transfer, the measurable output is strongly governed by how the transferred charges are trapped and retained within the dielectric. Material-dependent trap-state characteristics—including trap depth, trap density, and their spatial distribution—play a crucial role in determining both the magnitude and stability of the generated signals. Materials possessing high surface potential, but shallow traps, typically exhibit rapid charge dissipation, whereas materials with deeper or more abundant traps retain charges for longer durations, sustaining a steady output. This mechanism is consistent with our humidity-dependent results (Fig. 3d), where increased moisture enhances charge screening and promotes de-trapping, leading to accelerated signal decay despite minimal changes in intrinsic surface potential. These observations highlight that triboelectric performance arises from the interplay between surface potential and trap-state dynamics, and both factors must be considered when interpreting or predicting triboelectric behavior.

a Surface potential of 10 different materials measured by KPFM under 20–25% RH. b Representative output voltage signals generated by the dual-reference sensor upon contact with each material. Triboelectric Voc outputs of PDMS (blue, negative reference) and PEI(b)-PDMS (red, positive reference) upon contact with 10 different materials, measured under the same condition (pressure 2 N, separation distance: 20 mm) at (c) 20% RH and (d) 50% RH.

a Schematic of the deep learning framework for surface potential prediction based on triboelectric signals collected under mixed humidity conditions. Dual-reference triboelectric signals are processed and used to train models on seven labeled materials, while three unlabeled materials are reserved for testing. b Triboelectric voltage outputs for (i) training and (ii) testing materials under 20% RH, 35% RH, 50% RH, and 80% RH conditions.
Figure 4a outlines the overall procedure for training and testing the proposed framework to predict material surface potential using different DL models. The material surface potential prediction problem is a multivariate time-series regression problem since we estimate the surface potential of materials using sequential sensing signals. We build various DL models using the training dataset under mixed 20 and 50% RH conditions, where each sample consists of time-sequential measurements of PDMS and PEI(b)-PDMS with the surface potential labels of seven different materials, namely, PTFE, Kapton, PET, PMMA, Paper, Glass, and Nylon 11 (Fig. 4b(i)). The trained model is then used to predict the surface potential values of three other materials that were unknown during the training procedure, namely, PVDF, Al, and TPU, under 20, 35, 50, and 80% RH conditions (Fig. 4b(ii)). We evaluate the generalizability of the proposed models using test data for three materials under 35 and 80% RH conditions, which differ from the humidity conditions of the training data. Furthermore, we analyze the effect of the number of training data and the sampling rate to evaluate the robustness of prediction models. Since the raw measurement of the dual-reference sensor may include the uncertainty and bias of a specific experimental setup, we apply a simple signal difference as the compensation scheme. We denote the measurement of PDMS and PEI(b)-PDMS by \({x}_{t}^{1}\) and \({x}_{t}^{2}\), respectively, at time \(t\). We use differences between adjacent elements of time-sequential measurements of dual-reference,\({\triangle x}_{t}^{1}={x}_{t+1}^{1}-{x}_{t}^{1}\) and \({\triangle x}_{t}^{2}={x}_{t+1}^{2}-{x}_{t}^{2}\), as the input for training and testing datasets. The sequential input becomes the two-dimensional PDMS and PEI(b)-PDMS differences in triboelectric voltage output. These differential signals suppress low-frequency drift caused by environmental noise, contact variability, and instrumentation bias, while enhancing the transient features of triboelectric charge induction. To ensure consistency, we normalize the surface potential by considering the minimum and maximum bounds. We consider three different DL-based material recognition models, namely, long short-term memory (LSTM), convolution neural network (CNN), and temporal convolutional network (TCN), to predict the surface potential of three unknown materials of PVDF, Al, and TPU. We also use the conventional linear regression (LR) model as the reference to evaluate the conventional prediction performance. The network architectures of the different models are shown in detail in Supplementary Fig. 8, where FC, BatchNorm, ReLu, Conv, and DilatedConv denote the fully-connected layer, batch normalization layer, rectified linear unit, convolutional layer, and dilated causal convolutional layer, respectively. We tune the hyperparameters of different DL models using Bayesian optimization29,30. Bayesian optimization for hyperparameter tuning in DL is a method that efficiently searches for the optimal set of hyperparameters for DL models by leveraging probabilistic models and sequential decision-making.
Figures 5a, b, c present the predicted surface potentials of LR, LSTM, CNN, and TCN models with single-reference (only PDMS) and dual-reference for three testing materials, including PVDF, Al, and TPU under mixed 20% and 50% RH, 35% RH, and 80% RH conditions, respectively. The black dashed line is the true mean value of the surface potentials in each figure, while the bar presents the standard deviation of the predicted surface potentials. In Fig. 5a(i)–(iii), one of the interesting observations is that the various DL models, including LSTM, CNN, and TCN with dual-reference, show consistently smaller prediction errors than those using only single-reference input for testing materials under mixed 20% RH and 50% RH conditions. Besides, LR fails to predict the surface potential with large prediction errors for all testing materials due to its fundamental limitations in learning nonlinear data. The main reason is the highly time-varying and nonlinear nature of PDMS measurements due to the complex interaction between the triboelectric sensors and the material under different humidity conditions. Thus, it demonstrates the strength of employing a dual-reference triboelectric sensor as the input feature to the DL-based surface potential prediction model, leveraging nonlinear learning capabilities to represent complex relationships. Among the compared models, the TCN coupled with the dual-reference strategy achieves the most robust performance, yielding the lowest prediction error under mixed 20% RH and 50% RH conditions. We note that although the predicted mean of the surface potential of CNN using a single reference is closer to the true value than that of the dual-reference input for Al in Fig. 5a(ii), its standard deviation is considerably higher. The RMSE of the CNN using a single reference is still greater than that of the dual-reference for Al. We note here that the predicted value in this study represents the effective surface potential at 20% RH, derived from averaged KPFM measurements. Because triboelectric output integrates behavior over the entire contact area, the dual-reference signals capture this effective response rather than microscopic spatial variations. Accordingly, the model is designed to infer the 20% RH surface potential from triboelectric outputs measured at 20–50% RH, under the assumption of triboelectrically homogeneous surfaces. For surfaces with heterogeneous domains, the prediction would correspond to an area-weighted average. We further evaluated the proposed model for the three testing materials under additional humidity conditions of 35% RH and 80% RH, noting that all models were trained exclusively using data collected at mixed 20 and 50% RH. As shown in Fig. 5b(i)–(iii), the DL models with dual-reference inputs accurately predict the surface potential even at 35% RH, likely because the triboelectric outputs at 35% RH do not deviate substantially from those measured at mixed 20 and 50% RH. When comparing Fig. 5a, b, both the LSTM and CNN models actually perform slightly better at 35% RH than under the mixed 20% and 50% RH conditions used for training. In contrast, Fig. 5c shows that all models—including those using dual-reference inputs—struggle to predict the surface potential at 80% RH, where severe charge screening results in triboelectric signals that differ markedly from those observed at lower humidity levels. Nonetheless, the dual-reference models still correctly identify the sign of the surface potential, whereas the single-reference models fail to do so for Al and TPU in Fig. 5c(ii)–(iii).

(i) PVDF, (ii) Al, and (iii) TPU using LR, LSTM, CNN, and TCN models, with single-reference (PDMS only, gray) and dual-reference (PDMS + PEI(b)-PDMS, blue) inputs under different RH conditions: a mixed 20% and 50% RH, b 35% RH, and c 80% RH. The black dashed line in each plot represents the actual surface potential measured by KPFM at 20–25% RH.
Figure 6a, b, c summarizes the RMSE values of different prediction models using LR, LSTM, CNN, and TCN for three testing materials under mixed 20% and 50% RH, 35% RH, and 80% RH conditions, respectively. The proposed TCN model, incorporating the dual-reference feature, yields more accurate prediction performance than the LR, LSTM, and CNN models for various RH conditions. The main reason is that the dilated causal convolutional layer of TCN achieves better surface potential prediction than other models, while avoiding the exploding/vanishing gradient problems and the memory retention issues of typical recurrent models30. However, all models substantially degrade the RMSE prediction error due to the significant input distortion in the heavy humidity condition over 50% RH, as shown in Fig. 6c. By comparing Fig. 6a, b, both LSTM and CNN improve prediction accuracy even under 35% RH conditions than those of mixed 20% RH and 50% RH conditions. These results are comparable with Fig. 5. Another interesting observation is that the RMSE difference between single-reference and dual-reference inputs heavily depends on the model in Fig. 6a, b. While LR has a relatively small RMSE gain using dual-reference inputs, DL-based models, including LSTM, CNN, and TCN, show strong synergy, with a significant RMSE gain. We apply a model evaluation technique called leave-one-out cross-validation (LOOCV) to assess the performance of prediction models on small datasets. In LOOCV, the set of measurements of one material is used as the test set while the remaining 9 materials form the training set for each model. Thus, in each iteration, the model is trained on all data except one material, and then the left-out data of the single material is used for testing. This process is repeated 10 times, where 10 is the number of materials, and the results are averaged to provide an overall RMSE performance of different models. Figure 6d shows the RMSE of LOOCV of different models, including LR, LSTM, CNN, and TCN, with single-reference and dual-reference under mixed 20% RH and 50% RH conditions. Various prediction models with dual-reference show similar prediction accuracy, comparable to Fig. 6a, b.

using LR, LSTM, CNN, and TCN models, with single-reference (PDMS only, gray) and dual-reference (PDMS + PEI(b)-PDMS, blue) inputs under different RH conditions: a mixed 20% and 50% RH conditions, b 35% RH conditions, and c 80% RH conditions. d RMSE of LOOCV of predicted surface potential.
One of the fundamental challenges in DL–based regression models is their strong dependence on the size of the training dataset, as the amount of available data significantly affects prediction accuracy. When the training sample size is insufficient, the model easily overfits and exhibits degraded performance. To examine this effect, we evaluate the performance of different surface-potential prediction models under limited training data. Specifically, we vary the training data ratio \(r=0.2,\,\ldots ,\,1\) relative to the total number of available training samples. Figure 7a shows the RMSE values of LR, LSTM, CNN, and TCN with single-reference (solid line) and dual-reference (dotted line) inputs as a function of different ratios of training data. Overall, all models improve the surface potential prediction accuracy as the number of training samples increases. Besides, different prediction models with dual-reference input consistently perform better than those with single-reference input, even for a wide range of training samples. Adding more training samples considerably improves the RMSE values of all prediction models under the strictly limited training samples \(r\le 0.4\), while its gain is limited for \(r > 0.4\). Although the effect of training samples, \(r\le 0.4\), is more critical for DL models with a dual-reference sensor, the training samples \(r > 0.4\) provide reasonable prediction accuracy. When the dataset is sufficiently large, the performance gap between single-reference and dual-reference inputs becomes nearly constant. Thus, the primary performance bottleneck is the model architecture and input signal type rather than the number of training samples, once a reasonable amount of data is guaranteed.

RMSE of predicted surface potential for each model using LR, LSTM, CNN, and TCN models under mixed 20% RH and 50% RH conditions, with single-reference (PDMS only, solid line) and dual-reference (PDMS + PEI(b)-PDMS, dotted line) inputs, a with different ratios of the training samples, \(r=0.2,\,\ldots ,\,1\) b with different sampling rates, \({f}_{s}=100-500\,{\mbox{Hz}}\).
Since the sampling needs to capture the essential property of analog signals, the sampling rate of model inputs affects the prediction accuracy of different models. Figure 7b presents the RMSE values of different models with single-reference (solid line) and dual-reference (dotted line) inputs over various sampling rates \({f}_{s}=100-500{\mbox{Hz}}\). DL-based models with dual-reference input show considerably lower RMSE values than those with single-reference input for a wide range of sampling rates. Thus, the single-reference input is not enough to predict the surface potential even with a high sampling rate for different prediction models. The LR model fails to predict the surface even with a high sampling rate of dual-reference inputs, due to its limitations in learning nonlinear data. The trends of the RMSE values with dual-reference depend on both prediction models and sampling rates. Increasing the sampling rate certainly improves the RMSE values of both LSTM and TCN with dual-reference inputs for \({f}_{s}\le 200{\mbox{Hz}}\), while its gain becomes minor even for the high sampling rate, \({f}_{s} > 200{\mbox{Hz}}\). Nyquist frequency analysis shows that the minimum sampling rate of dual-reference inputs is between 10 and 80 Hz under mixed 20% RH and 50% RH conditions. The RMSE values of the CNN with dual-reference input decrease gradually as the sampling rate increases due to the exceptional ability of the CNN architecture to hierarchically learn the features from noisy sampled data. Overall, the effect of sampling rate is similar to those with the training samples in Fig. 7. Thus, the prediction model with input types is a critical factor when the training sample and sample rate are reasonably sufficient. Figure 7a, b shows the robustness of TCN for a wide range of training data and sampling rates.


